data-science-cheat-sheet
Inspired by this https://python-data-science.readthedocs.io/en/latest/_images/architecture.png
MLOps flow
- Structure: DESIGN + MODEL DEVELOPMENT + OPERATIONS
- Design: requirements engineering, use case prioritization, data availability check
- Model development: data engineering, model engineering, testing and validation
- Operations: model deployment, CI/CD pipelines, monitoring and alerting
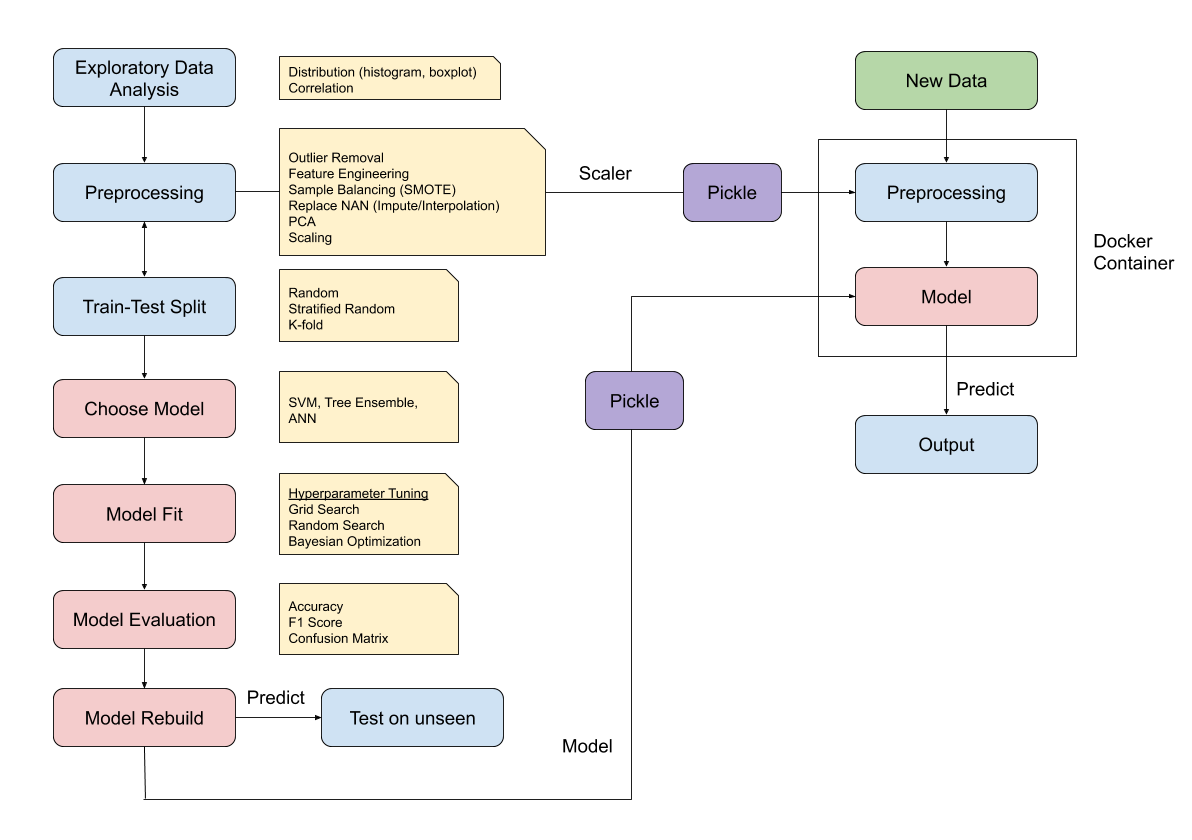
Model Design
- Exploratory Data Analysis
- Descriptive Statistics
- Distributions
- Boxplots - gives descriptions of the data with min/max, IQR and median
- Gives the 25th percentile to 75th percentile range which is the inter-quantile-range (IQR)
- Also gives the min and max which is defined as Q1 - 1.5 * IQR or Q3 + 1.5 * IQR
- Outliers are outside of the min and max range
- Correlations
- Data Preparation
- Feature Preprocessing
- Fill missing values or remove the column entirely if too many values are missing
- Impute with mean or median, interpolation with linear or other methods
- Remove outliers to ensure robustness of sensitive models
- As identified in box plots
- Encode features from string into integer
- sine/cosine transformation to maintain cyclic relationships
- Fill missing values or remove the column entirely if too many values are missing
- Split training and testing to avoid overfitting of the model the training data and avoid data leakage
- Feature Transformation Techniques to bring the distribution of the feature into a more normal like distribution
- Feature Scaling Techniques to bring features into the same space for model convergence
- Feature Engineering to create powerful features that is more informative for the model
- Class balancing to help models predict rare occurrences
- Feature Preprocessing
- Model Selection
- Supervised Learning
- Regression
- Linear Regression Model
- Polynomial regression model
- Quantile Regression
- Tree Regressors
- Classification
- Regression
- Unsupervised Learning
- Semi-supervised Learning
- Reinforcement Learning
- Recommendation Systems
- Supervised Learning
- Model Fit
- Loss Functions
- L1 loss function (sum of the absolute errors)
- L2 loss function (sum of the squared errors)
- Pinball loss function
- Hyperparameter tuning result in change in model performance and combined with cross-validation techniques we can find the best set of hyperparameters
- Grid Search
- Random Search
- Bayesian Optimization
- Loss Functions
- Model Evaluation
- Commonly used Error metrics to evaluate regression type models
- Bias-variance tradeoff
- The best predictive model is one that has good generalization ability which is able to predict accurately to new and previously unseen data
- high bias can lead to okay performance but too general -> under-fit
- high variance can lead to low errors with existing data but not necessarily with new data -> overfit
- Regularization Techniques
- L1 regularization (Lasso Regression) which reduces the coefficient values
- L2 regularization (Ridge Regression) which penalizes higher powers
- Model fit vs complexity
- AIC
- BIC
- SHAPLY
- Model Score
- Score on unseen data as the true evaluation of the model
- Serialization
- Pickling of the entire process of fitted data preparation and fitted model parameters
Inference testing
- Using sample data to make conclusions about a population parameter
- Frequentist Inference Testing
- Bayesian Inference Testing
Causal Inference
- Establishing cause-and-effect relationships. It aims to determine whether a change in one variable (the cause or treatment) leads to a change in another variable (the effect or outcome)
- AB Testing
- Difference in difference
- Fit a regression to the two groups to the observed metric and the coefficient estimated is the difference